

The materials for following reconstruction examples are taken from ATOMOSYD - website of the research group from the University of Rouen, France, dedicated to topological analysis and modeling of dynamical systems
Canadian lynx

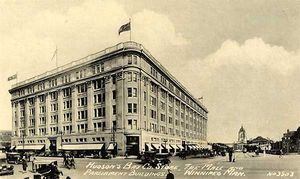

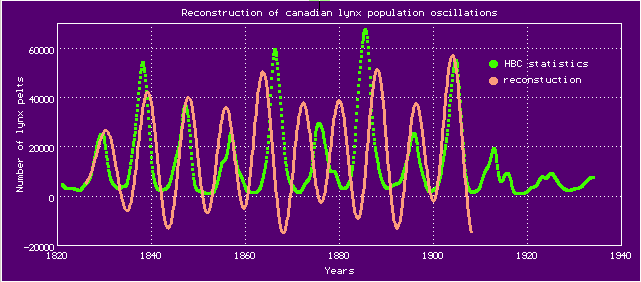
The Hudson's Bay Company (HBC), engaged in, among other business, fur harvesting in Canada, in the XIX-XX centuries kept statistics regarding the number of produced Canadian lynx and snowshoe hares pelts. Data about lynx pelts, published in the article:
form a time series, suitable for the reconstruction of a dynamical system, describing the lynx population fluctuations. Following the recommendations in article:
and using previously interpolated data of dependence the number of lynx on the year given on the page "Canadian lynx counted by the Hudson Bay Company" of ATOMOSYD website, with DEREK's assistance, we can build a chaotic dynamical model of 4th order, which in general adequately describes the fluctuations of the Canadian lynx population:
Plague in Bombay

W.Haffkine vaccinates Indian peasants


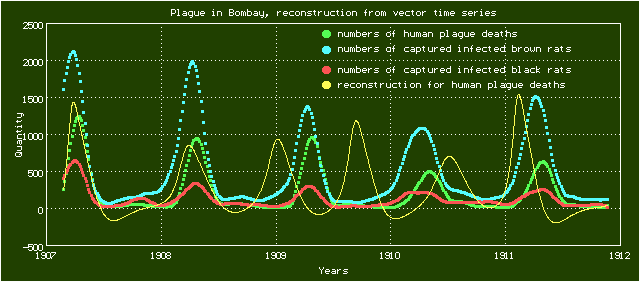
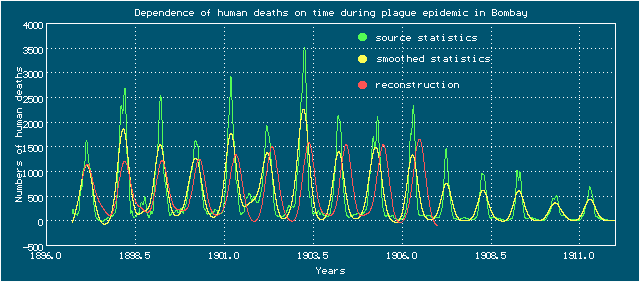
In following article: S. Mangiarotti, Low dimensional chaotic models for the plague epidemic in Bombay (1896-1911), Chaos, Solitons & Fractals, 81, 184-196, 2015 the statistical data about the spread of the plague during the Bombay epidemic in 1896-1911 is studied. The author managed to build some dynamical models describing the relationship between the numbers of the human deaths at the time of the epidemic with the numbers of caught infected brown rats (Rattus norvegicus) and black rats (Rattus rattus). Using the data (vector time series and dynamical model) from this article, provided on the "Chaotic seasonal variations of plague in India (1896-1911)" page at ATOMOSYD website:
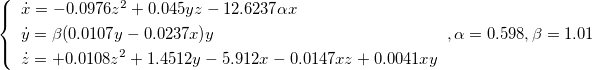
(in this model, x means the number of human plague death; y and z are the numbers of captured infected brown rats and black rats respectively), with DEREK's assistance it's easy to reproduce the modeling results:
In mentioned article the author resorts to the sophisticated algorithm for choosing the members of polynomial on many variables in system right-hand side, described in: S. Mangiarotti, R. Coudret, Laurent Drapeau, Lionel Jarlan. Polynomial search and global modeling: Two algorithms for modeling chaos. Physical Review E, American Physical ociety, 2012, 86(4), pp.046205.
DEREK is unable to use this algorithm, so it can't construct the dynamical model for this vector time series. But nevertheless using DEREK it's possible to build a model for scalar time series that contains only numbers of human deaths and more stretched, it is also available on the ATOMOSYD website. For the simulation, user can smooth out the original time series by using a smoothing spline, and then build a model of 4th order (chaotic) based on smoothed scalar time series:
Reconstruction
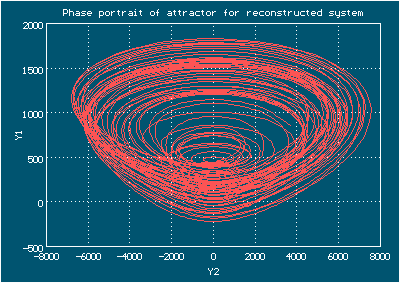
Reconstructed system attractor
For both examples above the data from ATOMOSYD website have been used directly with minimal changes (lines that do not contain numeric data were commented out in text files), all of the processing and all plots can be performed from within DEREK. In both cases the polynomials of order 2 on dynamical variables were chosen in right-hand side for reconstruction, a few attempts were done to pick up an appropriate reconstruction window (the range of independent variable) and smoothing level for derivatives.